
 Enforced international breaks and early cup exits serve to create a fragmented season and leave a massive thumb-twiddling void on a winter weekend. Desperate times call for desperate measures and taking refuge in the shed on the pretext of rearranging your tools is perhaps the only chance of dodging an afternoon at the shops.
Without a match to preview the internet turns its attention away from fitness tests, possible formations, and pearls from the managerial press conference to concentrate on the ‘alternative facts’ that surround sport as well as politics. Here are a few items picked up from the reported West Ham buzz.
Warm Weather Training
The first team squad have departed for a spot of warm weather training in Dubai in order to, according to the Official West Ham website, ‘hone their preparations’ – so we can be reassured that on their return the team will be much improved on how to prepare, which has to be good news. It was pleasing to see from the training camp video clips that Andre Ayew was involved and had, therefore, recovered from the ‘emotional fatigue’ that kept him out of last weekend’s match-day squad.
I can recall Fat Sam doing similar warm weather training camps in the past as a reward for throwing FA Cup games but my memory is rather hazy as to whether the players returned champing at the bit and played with renewed vigour. Interestingly, Sam wanted to take his current side to Dubai this week but the plan was vetoed by the Palace Board on the grounds that fans would not be best pleased given recent performances. This seems to be rather twisted logic if it is believed that there is merit from such trips in terms of fitness team spirit; or maybe it is just a jolly.
Possibly the West Ham squad are also taking part in some of those excruciating, compulsory fun, team building games that I was forced to take part in during my own working career. These could include such useful and pertinent activities as who can build the biggest free standing tower using only drinking straws (I reckon Winston Reid would win this) or having to guide a group of blindfolded teammates through a maze of static obstacles. On second thoughts that last one sounds like a variation of an attack versus defence exercise.
Transfer Mania
The recent closing of the January transfer window has not tempted the rumour industry to take a well-earned winter break to ensure better preparation for its grand re-opening in the summer.
As usual West Ham are linked with all and sundry and in the absence of any coherent transfer strategy it is difficult to judge whether all or any of these are credible or otherwise. In the majority of cases the linked players are those at the end of their contracts at other Premier League clubs and looking for one last final payday. I had hoped that we would be wise to such a short sighted strategy by now but who knows what is in the mind of the decision makers? Apparently we now also have a preference for buying British born players while at the same time being reluctant to take a chance on players from the lower leagues. For me, a transfer recruitment strategy based on a style of play that is independent of any single manager would seem the most sensible for the club in its present position.
On the other side of the transfer coin, comments made by Michail Antonio and Manuel Lanzini have triggered speculation that they may be on their way to pastures new. I think we can take each of these with a pinch of salt at the moment. How can Antonio know whether he will sign a new contract that might be offered in the summer until he has seen it? To report this as talks having stalled or that he is uncertain is nonsense. By the same token, is it unreasonable for Lanzini to suggest that he would like to return to River Plate one day? If he continues to perform like he has over recent games there will be far more lucrative offers coming his way than anything River Plate can offer. A return at the end of his career would seem most feasible.
The other trending (or heavily cut and pasted) story is that the manager has ‘lost patience’ with ‘misfit’ Arthur Masuaku and that he will be taking his handballs elsewhere next season. On the face of it this again seems unlikely for a player who has shown promise but has been injured for most of the season.
The Manager’s Contract
A story that is unlikely to go away until the summer is whether manager Slaven Bilic gets a contract extension. He is very popular with many fans and he comes across as a very warm, personable character who as an ex-player also knows and understands the club and its supporters. All of this may well be true but ultimately the question is how far passion alone can take someone? Has an ex-player ever made a rip-roaring managerial return to the club he played for?
I believe there is a strong correlation between money and league placing. On average we should be finishing around 7th or 8th place as a matter of course; it should not be seen as over-achieving; I doubt that we have ever had an over-achieving manager and maybe that is part of the attraction of being West Ham. In my mind Slaven has done a good job rather than a great one. Sure the football has been better than his predecessor (although for large parts of this season it was not so different) but there remain concerns on tactics, selection, fitness and player recruitment; even if he is implicated in the latter rather completely responsible.
I am on the fence at the moment. At least he has some further time to prove his worth and to demonstrate that he is capable of a longer term consistency and planning. As a person he is certainly a top man but I am undecided as to whether he the managerial equivalent of the 5 blade razor; the best West Ham can get?

 Love is in the air but it has not always been a week of romance (even of the cup variety) with West Ham victims of a variety of harrowing Valentine’s Day massacres over the years.
 I have written on a number of occasions regarding games involving West Ham and any team managed by Tony Pulis. My articles go back years to when he was the manager of Stoke City, and how I detested their time wasting tactics, their blocking off the ball (American Football style), and their long throw game. Now that he is manager of West Brom he has produced a team of giants who have had a successful season, exceeding everyone’s expectations, and who currently sit in eighth place in the Premier League.
 That’s Entertainment
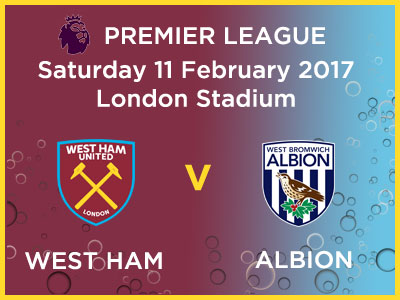 Having stealthily clawed their way to 9th in the Premier League table, with a sequence of effective rather than spectacular performances, West Ham will seek to build on the resurgent air of optimism at the London Stadium by stamping their authority of today’s encounter with West Bromwich Albion.

 Twenty-four rounds of games in the Premier League have now been completed. That means we have now predicted the results of 240 matches.
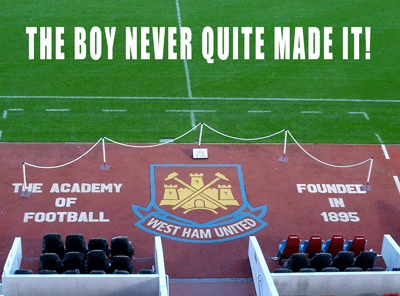 West Ham is a club that likes to promote itself as the academy of football and there is nothing as rewarding for a supporter than seeing a young player break through from the youth system and establish a career in the claret and blue; especially when that youngster is a local lad. In reality the record over the years in producing young talent has been rather patchy albeit there have been some spectacular successes and periods of plenty. In this occasional series we look at those young players for whom there were high hopes but were unable to become local heroes at West Ham.
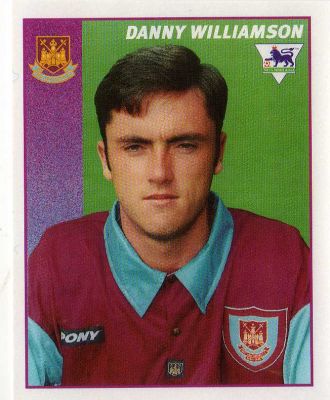 Danny Williamson was the perfect academy star, a keen West Ham supporter who was born in Plaistow and played locally for Newham and Essex boys before committing his future to the Hammers, despite the lure of interest from Arsenal. After signing his first professional contract Danny enjoyed short loan spells at non-league Farnborough Town and third division Doncaster Rovers before getting his first team opportunity at West Ham.