
As always, co-weblogger Geoff summarised the game excellently in his article on the game published in Under The Hammers on Sunday: 5 Observations from Victory at St Marys. We were seeking revenge for our early season defeat at the hands of Southampton, and achieved it well.
Throughout this blog we have commented on the plethora of statistics surrounding football and I’ll add some more today.
In the Hull v Liverpool game, Liverpool “won” the possession statistics 72% to 28%, the shots 11 to 7, completed passes 523 to 162, and the pass success 82% to 62%. You all know the score of the game. Hull 2, Liverpool 0.
In the Palace v Sunderland game, Palace “won” the possession statistics 65% to 35%, the shots 17 to 10, completed passes 399 to 195, and the pass success 81% to 71%. You all know the score of the game. Palace 0, Sunderland 4.
In the Everton v Bournemouth game, Bournemouth “won” the possession statistics 54% to 46%, the shots 16 to 12, completed passes 476 to 391, and the pass success 86% to 82%. The final score was Everton 6, Bournemouth 3.
In the West Brom v Stoke game, Stoke “won” the possession statistics 62% to 38%, completed passes 416 to 220, and the pass success 81% to 70%. The final score was West Brom 1, Stoke 0.
In the Chelsea v Arsenal game, Arsenal “won” the possession statistics 59% to 41%, completed passes 475 to 326, and the pass success 84% to 80%. And the game ended Chelsea 3, Arsenal 1.
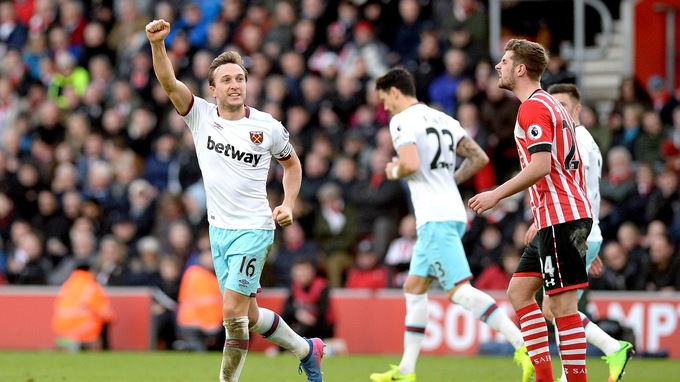
And finally in our game, Southampton v West Ham, Southampton “won” the possession statistics 55% to 45%, the shots 18 to 5, completed passes 388 to 296, and the pass success 82% to 76%. You all know the score of the game of course. Southampton 1, West Ham 3.
I think that I have proved my point! The TV and written media love to show us these statistics when a game is in progress (sometimes they give you the last ten minutes), and at the end of the match. So what do they prove? Of course it doesn’t always happen this way. Sometimes the team with the most possession and pass success rate will win the game.
I’ll leave you to judge the relationship between the data and the outcome of games. I’ve picked out six of the eight games played on Saturday in this last weekend. I suppose losing managers can hide behind the data to try to prove that they were unlucky. But the only meaningful statistic is goals scored. In each of the games I’ve highlighted the team that “won” in terms of the data lost the game. The teams that “lost” in terms of the data were the ones who picked up the three points.
Despite the four goals scored in the game we were still as low as sixth on Match of the Day! The win was well deserved in spite of the statistics I’ve quoted above. Gabbiadini, a player we have been linked with in the media in the past, took his goal well, although he looked offside to me. I haven’t seen a replay but I’ll be amazed if he was onside.
The timing of our goals couldn’t have been much better. The equaliser from Carroll proved that his right foot isn’t just for standing on, and he coolly slotted the ball home just a minute or two after we had gone behind. Obiang has been threatening to score for a long while now, and his goal on the stroke of half-time was well struck from outside the area. And finally Mark Noble’s free kick, as the Saints were threatening to get back into the game early in the second half, was rightly credited to him, despite taking a deflection of a Southampton boot. The “rules” of goals accreditation work on the basis that if the ball was bound for the goal, then even if it is deflected off a defender, the goal is given to the player who shot. It would have only been given as an own goal if Noble’s shot was deemed to not be heading into the goal.
Three more points and ninth in the table. We have a very important game at home to West Brom next, where a win would help enormously if we want to close the gap on them.
