
It all started with low expectations, went mostly downhill, and ended in a slurry of sleaze and shady behaviour. With the Gold and Sullivan era hopefully gone forever, we look back on the numbers which define this wasteful and distasteful period of West Ham history.
16 – the number of seasons ‘competing’ in the topflight. The first match on 26 January 2010, a 1-1 draw away at Portsmouth leaving West Ham in 16th position. The last, a 3-0 home win on 24 May 2026 confirming the Hammer’s relegation with an 18th place finish.
2 – the number of Premier League relegations. One a consequence of their first disastrous managerial appointment in 2011. The other, the culmination of shocking mismanagement in the aftermath of the European Conference success and the transfer of Declan Rice.
6 – the number of top ten finishes (excluding the Championship year) out of 16 attempts. The highest was 6th place in 2020/21, a season which also set West Ham Premier League records for number of wins (19) and points gained (65).
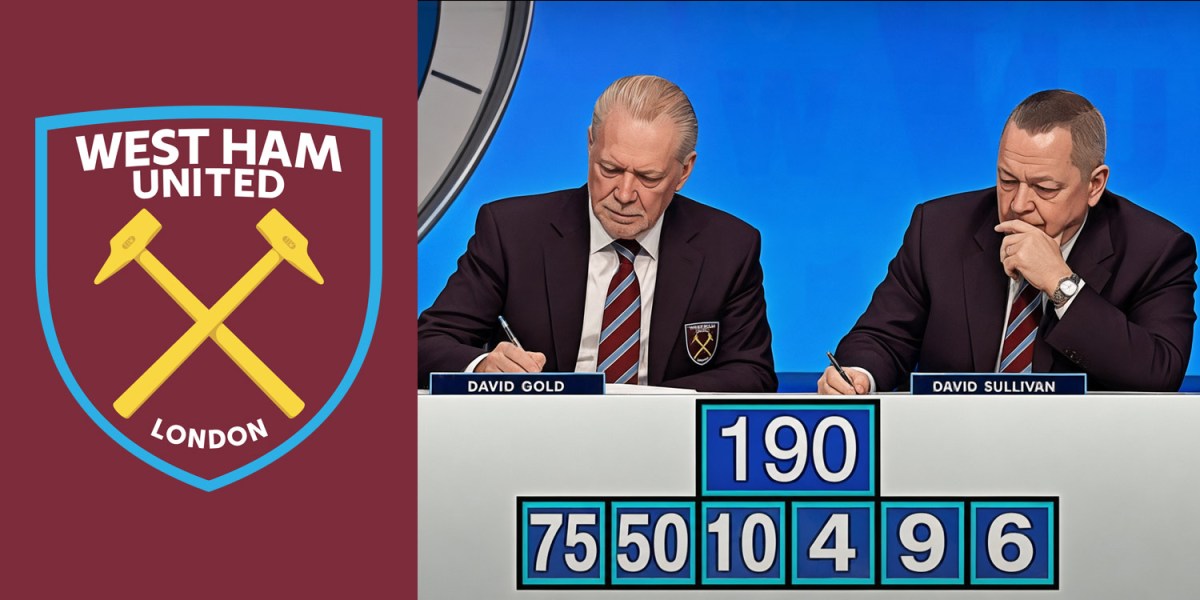
633 – total number of league games played, of which 214 were won (33.8%) and 258 lost (40.7%). In the Premier League only, the 190 victories from 587 games (32.3%) were overshadowed by 250 defeats (42.6%). West Ham stand proud as holders of the record for all-time number of Premier League defeats.
13th – the average league finishing position throughout the Gold and Sullivan years. This is reflected in an average Premier League points tally of 45. As a club featuring regularly among the world’s top twenty richest – and one of the top 8 richest in England – these are far from impressive statistics.
3 – the number of topflight seasons when West Ham won more league games than they lost. And unsurprisingly, these are also the only seasons that ended with a positive goal difference. The seasons in question: 2015/16, 2020/21 and 2021/22.
9 – number of managers employed – technically, it is 10 if you count David Moyes twice. The entire rogue’s gallery comprises Gianfranco Zola, Avram Grant, Sam Allardyce, Slaven Bilic, David Moyes, Manuel Pellegrini, Julen Lopetegui, Graham Potter, and Nuno Espirito Santo. The strongest link in terms of Premier League win percentage is David Moyes (36.87%). The weakest was Avram Grant (18.92%). Anywhere between 45% and 55% is usually considered to be a strong managerial performance.
2.9 billion – the cumulative amount in pounds received in revenues over 17 seasons from broadcast, matchday and commercial sources. A club record of £270 million was posted in the 2024 accounts. It is estimated that relegation will cost the club at least £100 million in income next season.
1.34 billion – the amount paid in euros (sorry, all Transfermkt data is in euros) for player transfer fees. At today’s exchange rate that is £1.15 billion. In addition to the 92 players signed for a fee, there were 36 free transfers and 41 loans – a total of 169 players in all. The record signing was Sebastien Haller at €50 million with another 17 players costing €25 million or more.
650 million– the amount received (€) for player transfers. West Ham sold 67 players and allowed 55 to leave on a free. The record sale was Declan Rice (€116 m) with only five other players sold for €25 million or more. The sale of Rio Ferdinand in 2000 continues to hold sixth place in the ranking of highest transfer fees received.
1.1 billion– the cumulative amount (£) paid in wages to achieve very little. The wage bill as well as transfer spend has increased significantly in recent years. All to assemble a squad fit for relegation.
16,711,118 – the number shuffling through the turnstiles at West Ham home matches, both at Upton Park and the London Stadium.
47,475 – the average home attendance (excluding COVID restricted games) across 352 matches – they keep turning up regardless. The average for games played at Upton Park was 32,836. At the London Stadium, 58,219. Attendance numbers have now become theoretical rather than actual body counts with the highest recorded attendances of 35,005 at Upton Park and 62,477 at the London Stadium.
214 – total number of players fielded by West Ham during first team games in all competitions. 81 of whom made fewer than 10 starts for the club.
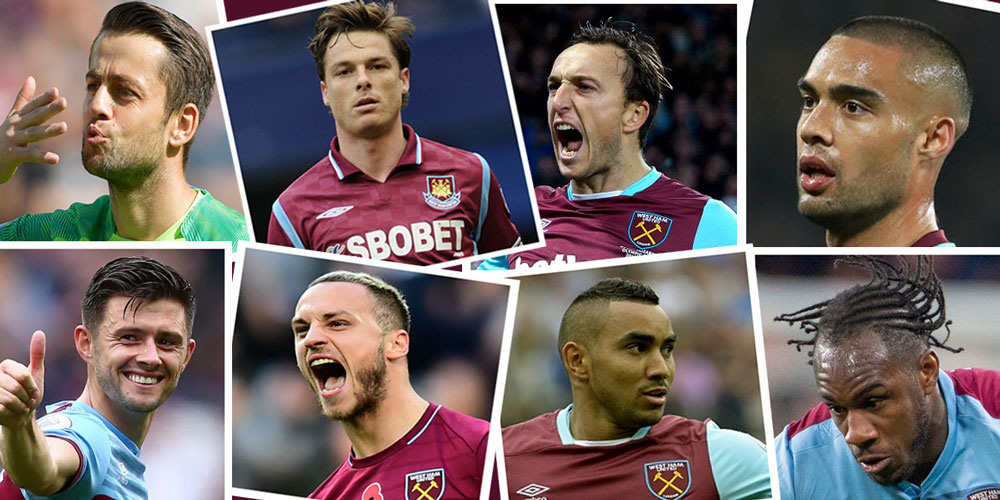
426 – the highest number of appearances made by an individual player during the GSB era – Mark Noble. Next best is Aaron Cresswell at 369 with the following each breaking the 200 barrier: Michail Antonio (323), Tomas Soucek (284), Jarrod Bowen (280), Angelo Ogbonna (249), Declan Rice (245), Manuel Lanzini (226), Winston Reid (222), James Tomkins (205) and Pablo Fornals (203).
85 – the most goals scored by an individual player in all competitions – the ever-reliable Bowen. Antonio is next with 83 and he remains the club’s all-time leading Premier League goalscorer (68 to Bowen’s 65.) Just 5 other players managed 20 or more Premier League goals to their name. These are Soucek (41), Noble (37), Andy Carroll (33), Lanzini (27), and Marko Arnautovic (21). The frequently injured Carroll is the only player brought in as an out and out striker to feature on the list.
16 – most league goals scored in a season by an individual player – Bowen in 2023/24. Second place with 14 goes to Carlton Cole in the 2011/12 Championship season. West Ham players have reached double figures on just eight other occasions in the Premier League: Bowen (13) in 2024/25, Bowen (12) in 2021/22, Arnautovic (11) in 2017/18, Antonio (10) in 2019/20, Antonio & Soucek (10) in 2020/21, Diafra Sakho (10) in 2014/15 and Kevin Nolan (10) in 2012/13.
1069– the total number of goals scored by West Ham (1.39 per game) in all competitions. Goals conceded totalled 1083 (1.41 per game). For league games only, the numbers are 849 for (1.34 per game) and 952 against (1.50 per game).
8 – the most goals scored by West Ham in a single game – the 8-0 win against Macclesfield in the 2018/19 League Cup. The biggest league win was 6-0 in the Championship against Brighton (2011/12). Although West Ham scored 5 on 4 occasions in cup competitions, they were unable to repeat that feat in the Premier League. Ironically, the last 5 goal haul came just before the takeover – a 5-3 win over Burnley in November 2009. The Hammers bagged 4 on 30 separateoccasions, 20 times in topflight games.
6 – most goals conceded in a single match – once in a 6-0 league cup semi, first leg defeat by Manchester City in 2014, and again in the league versus Arsenal in 2024. The West Ham rearguard conceded 5 goals on 12 occasions and 4 goals 33 times.
8 – highest aggregate score in a West Ham game – the 8-0 win against Macclesfield. There were 7 games featuring 7 goals – 4-3 wins against Huddersfield and Portsmouth, 2-5 losses to Liverpool and Arsenal, and 3-4 defeats to Bournemouth, Palace and Newcastle.
139 – the number of West Ham clean sheets earned in Premier League games (23.6% of games played)
161 – the number of Premier League games in which the Hammers failed to score (27.4%)
35 – the total number of goalless games featuring West Ham (5.9%). Goalless draws peaked during the Sam Allardyce years, accounting for 40% of the total.
13 – the number of players to win the Hammer of The Year Award. Declan Rice has three wins, Scott Parker and Mark Noble two, Winston Reid, Aaron Cresswell, Dimitri Payet, Michail Antonio, Marko Arnautovic, Lukasz Fabianski, Tomas Soucek, Jarrod Bowen, Aaron Wan-Bissaka, and Konstantinos Mavropanos one each.
1 – the number of trophies won. That night in Prague and victory over Fiorentina in the Europa Conference League. A victory that the owners hoped to dine on for eternity. West Ham competed in five European campaigns. Two under Slaven Bilic where they were eliminated in the qualifying rounds and three under David Moyes. As well as the Conference win, the Moyes campaigns saw one semi-final and one quarter-final Europa League appearance, losing both to German opposition.
0 – the number of domestic trophies won or finals reached. In the FA Cup, the best efforts were quarter-final exits in 2011, 2016 and 2026. In the League Cup, the Hammers were losing semi-finalists in 2011 and 2014 and were knocked out in the quarter finals four times. Ironically, the best performing cup year was the Avram Grant relegation season.
0 – the number of people disappointed at seeing the back of David Sullivan


 When I was young (I’m talking about between the ages of around 8 to 11, so over 50 years ago) I used to badger my dad to buy the People newspaper every Sunday. Apart from liking their match reports, they were the only paper (to my limited knowledge at the time) who gave the players ratings out of 10 for the game played the day before. You have to remember that all games were 3pm kick offs on a Saturday at that time, so apart from midweek games, I was able to collate the figures for most of the West Ham games throughout the season. I used to painstakingly write out on a schedule the subjective scores of the reporter at the game, and then as the season progressed I would calculate the averages. In this way I believed I was working out which players were the best. I didn’t keep my schedules, although I can recall that Bobby Moore and Johnny Byrne always figured highly at the time.
 A few weeks back I used the tedium of the international break to take a look at the