So we have an experienced Premier League manager in charge. He has kept us in the top flight when many thought we might struggle. Many are happy that he has done his job, but some believe that a change is needed. So at the end of the season the experienced manager departs, and the board bring in someone who has not managed at the top level in English football. Some think it is a risk. He probably wasn’t the first choice of the board but he gets the job. All new managers have a honeymoon period where the fans will allow some dodgy early results. And we do have some unexpected defeats at the beginning of the season.
But the performance of the club improves, and as the season progresses we have some great results. We do much better than most would have expected.
On October 24th we beat Chelsea 2-1 at Upton Park. We have some unexpected victories away from home. A seventh placed finish at the end of the season exceeds West Ham’s usual position in the Premier League.
So hopes are high for the season to follow. We have a talented squad, and a star player idolised by the supporters. But the season doesn’t quite go to plan. Early on we are playing a game at home and hold a two goal lead, but we don’t hold on to it, and fail to win the game. How the season might have been different if we had we won that game.
The early season results continue to fail to meet the high expectations held by the fans, and everyone associated with the club is disappointed with the start we have made. We visit White Hart Lane to play our arch enemies from North London. It’s a typically competitive derby and we lose the game 3-2 to a last minute goal. And one of our centre backs is sent off.
We are in the month of November, and after twelve games of the season have been played we have just eleven points. Not in the bottom three, but only just outside of it. That is less than a point a game. Relegation form many believe. Many will argue differently. Our team is a good one. Too good to go down. It will all come good soon.
Now most of you will think that I am writing about our current predicament. But I am not. Going back to the start of this article, the experienced manager is Harry Redknapp. The new manager is Glenn Roeder. In Roeder’s first season in charge in 2001-2002 we did beat Chelsea 2-1 on 24th October. We did have some unexpected victories away from home. We did finish seventh in the Premier League. Hopes were high for the season to come. In 2002-2003 we did have a talented squad. Di Canio was our star player and was idolised by the fans. We were leading Arsenal 2-0 but failed to win the game. How the season might have been different if we had held on to that lead and picked up three points. We did lose 3-2 at Tottenham to a last minute goal, and Ian Pearce was sent off. After twelve games we had eleven points. But most weren’t worried. Most believed we were too good to go down.
For Harry Redknapp read Sam Allardyce. For Glenn Roeder read Slaven Bilic. In Bilic’s first season we did have some unexpected defeats at the start (Leicester, Bournemouth) and we did beat Chelsea 2-1 at Upton Park on 24th October. We did have some unexpected victories away from home. We did finish in seventh place in the Premier League. We went in to the new season (this one) with high hopes. We did hold a two goal lead in an early game (Watford) but failed to win the game. How might this season have been different if we had picked up three points then? We did just lose 3-2 to a last minute goal at Tottenham, and for centre back Ian Pearce being sent off, read Winston Reid. And we have got just eleven points after twelve games of the season. And we are not in the bottom three, but just above it.
The parallels when comparing 2001-2, and 2002-3, are uncannily like 2015-16 and 2016-17. But of course 2016-17 isn’t over yet. We are just twelve games in. But for those who believe that history might continue to repeat itself, shall we look back to what happened at the end of 2002-3?
We finished in eighteenth place and were relegated despite some improved performances towards the end of the season. But how could it have happened? We were too good to go down they said. After those first twelve games in 2002-3 we then didn’t win a single game in our next nine league matches. It won’t happen this time will it? We are too good to go down. Aren’t we?
 It is not often that you score 4 goals away from home but still end up losing but that was the case in the Second Division game against Blackburn Rover on 25 November 1989 where goals from Dicks, Brady, Slater and Ward could not prevent the Hammers suffering a 5-4 defeat. In the Hammer’s lineup that day was Justin Fashanu making one of just two of his starts in the claret and blue as he attempted to resurrect his career.
 From the Jaws of Victory
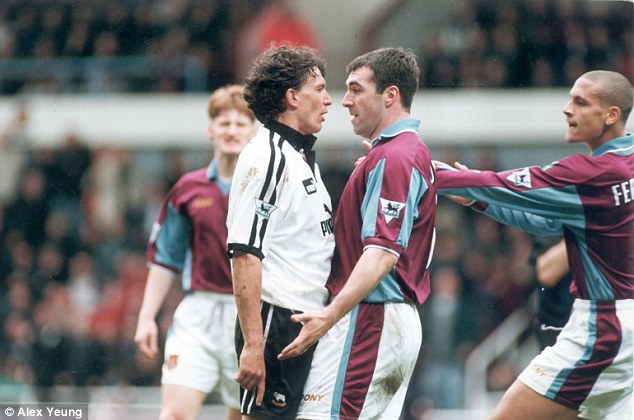
 To the combatants and the committed a West Ham versus Spurs derby is one of the biggest games of the season. To the outsider it is simply another Premier League fixture. Tottenham may pretend that it is not so important to them but losing to their noisy neighbour always hits them hard. They regard West Ham with the same self-appointed conceit and arrogance that Arsenal view them with; as the Gunners pursue their main London rivalry with Chelsea.
 Eleven rounds of games in the Premier League have now been completed. That means we have now predicted the results of 110 matches. Lawro has narrowed the gap at the top of the prediction league once again this week.